Writing and Essays - Selected Professional Presentations
This section contains power points that have been presented in a pdf format. You will need Adobe Acrobat Reader to download the information. In addition, if you want to provide me feedback on any of the items presented below, contact me at rkauffman@frostburg.edu.

The Drowning Trap: The Drowning Trap was an outgrowth of the Potomac River Study. In essence, when there are Spring flows during the summer, river fatalities tend to increase.
The study found that most people drown at moderate waters levels when the river was still well within its banks. When river users were asked when a river is dangerous, they described flood type conditions (e.g. water over the banks, muddy water, dead cows floating down the river, etc.). Hence, the "trap" like conditions because people don't recognize the potential danger of moderate water levels.
Most rivers reach low flow during the summer when people tend to visit them. They tend to pool and lose their power as a contributing factor in facilitating accidents. Also, since most people visit the river only once or twice a year, they have no perspective of when the river is higher than usual.
The Drowning Trap was published in Trends Magazine. In addition, it was presented at the Boating Summit below. The power point was used in that presentation. Click here or on the graphic above to view the pdf file of the power point.
The Drowning Trap
The International Boating and Water Safety Summit
Joint Program of the National Safe Boating Council and National Water Safety Congress
Daytona Beach, Florida
April 28 to May 1, 2002
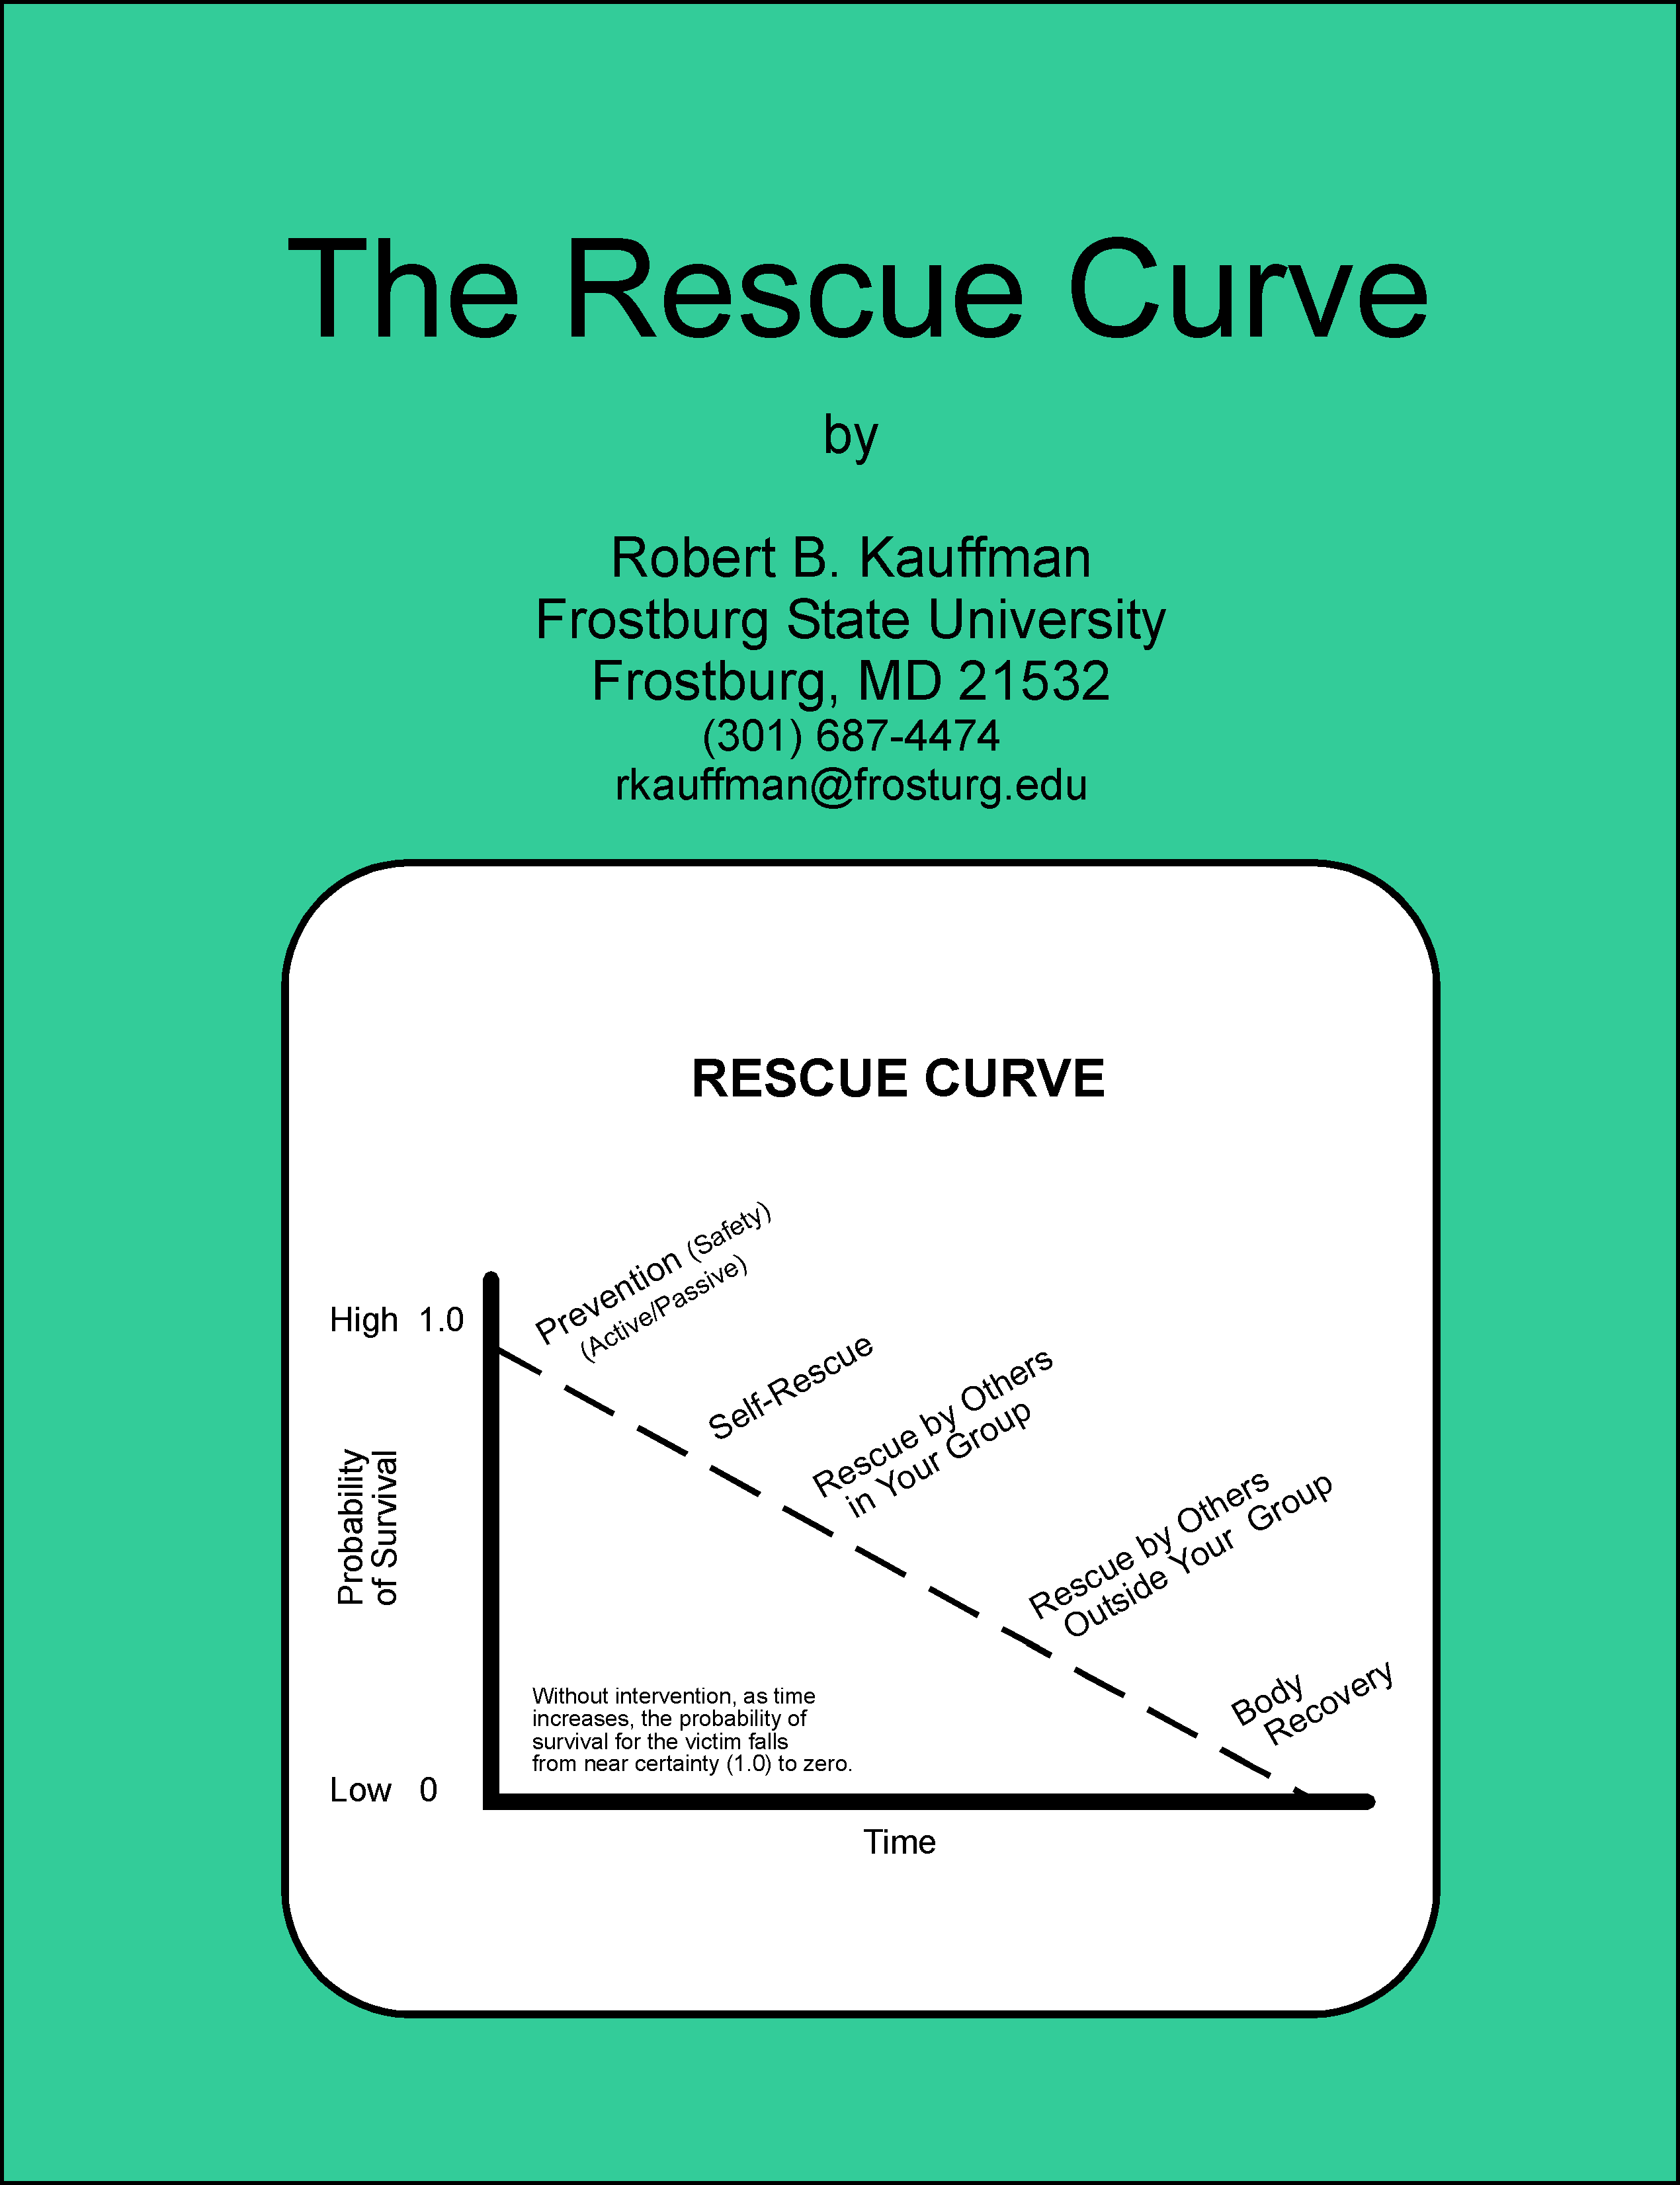
The Rescue Curve. The Rescue Curve is a model of the accident process. It is an outgrowth of the film: Heads Up. Essentially, it states that once an incident occurs that could lead to injury, damage or loss (i.e. an accident), that the probability of injury, damage, or loss increases as time increases. A person has four lines of defense that generally happen sequentially: 1) the safety measures taken, 2) self-rescue, 3) rescue by others in your group, and 4) rescue by others outside of your group including rescue squads. Each of the phases has different characteristics in terms of personnel, equipment and skill available. Click here or above on the graphic to view the pdf power point on the Rescue Curve.
The Rescue Curve
The International Boating and Water Safety Summit Las Vegas, Nevada
April 14-16, 2003

Alcohol and Dehydration Study. This study was an outgrowth of researching the content for the boating fundamentals book. At the time, it was found that the effects of alcohol and dehydration on the body seem to parallel each other and that they could complement or build upon each other in their effects. An experimental study was conducted with a small sample size that measured the effects of dehydration on blood alcohol levels. Blood alcohol levels were measured using a breathalyzer and blood tests.
To determine a baseline, non-dehydrated subjects were given alcohol that raised their BAC to .04%. Nine subjects were tested using a breathalyzer and six subjects were tested using whole blood samples.
The following week the same experiment was repeated using the same subjects except that the subjects were mildly dehydrated using a sauna (average of 2% loss). Using a breathalyzer, the average BAC for the same amount of alcohol was .07% or a 75% increase in BAC for the dehydrated subjects. Statistical significance at the .001 level was obtained between the breathalyzer and non-dehydrated groups.
In addition, there was a slight difference between the breathalyzer and whole blood tested groups (i.e. .06% versus .05%). Although statistical differences were not found, in part due to the small sample size, the results suggest that the breathalyzer maybe providing inflated readings for dehydrated subjects.
Click here or on the graphic above to view the power point summarizing the alcohol and dehydration study.
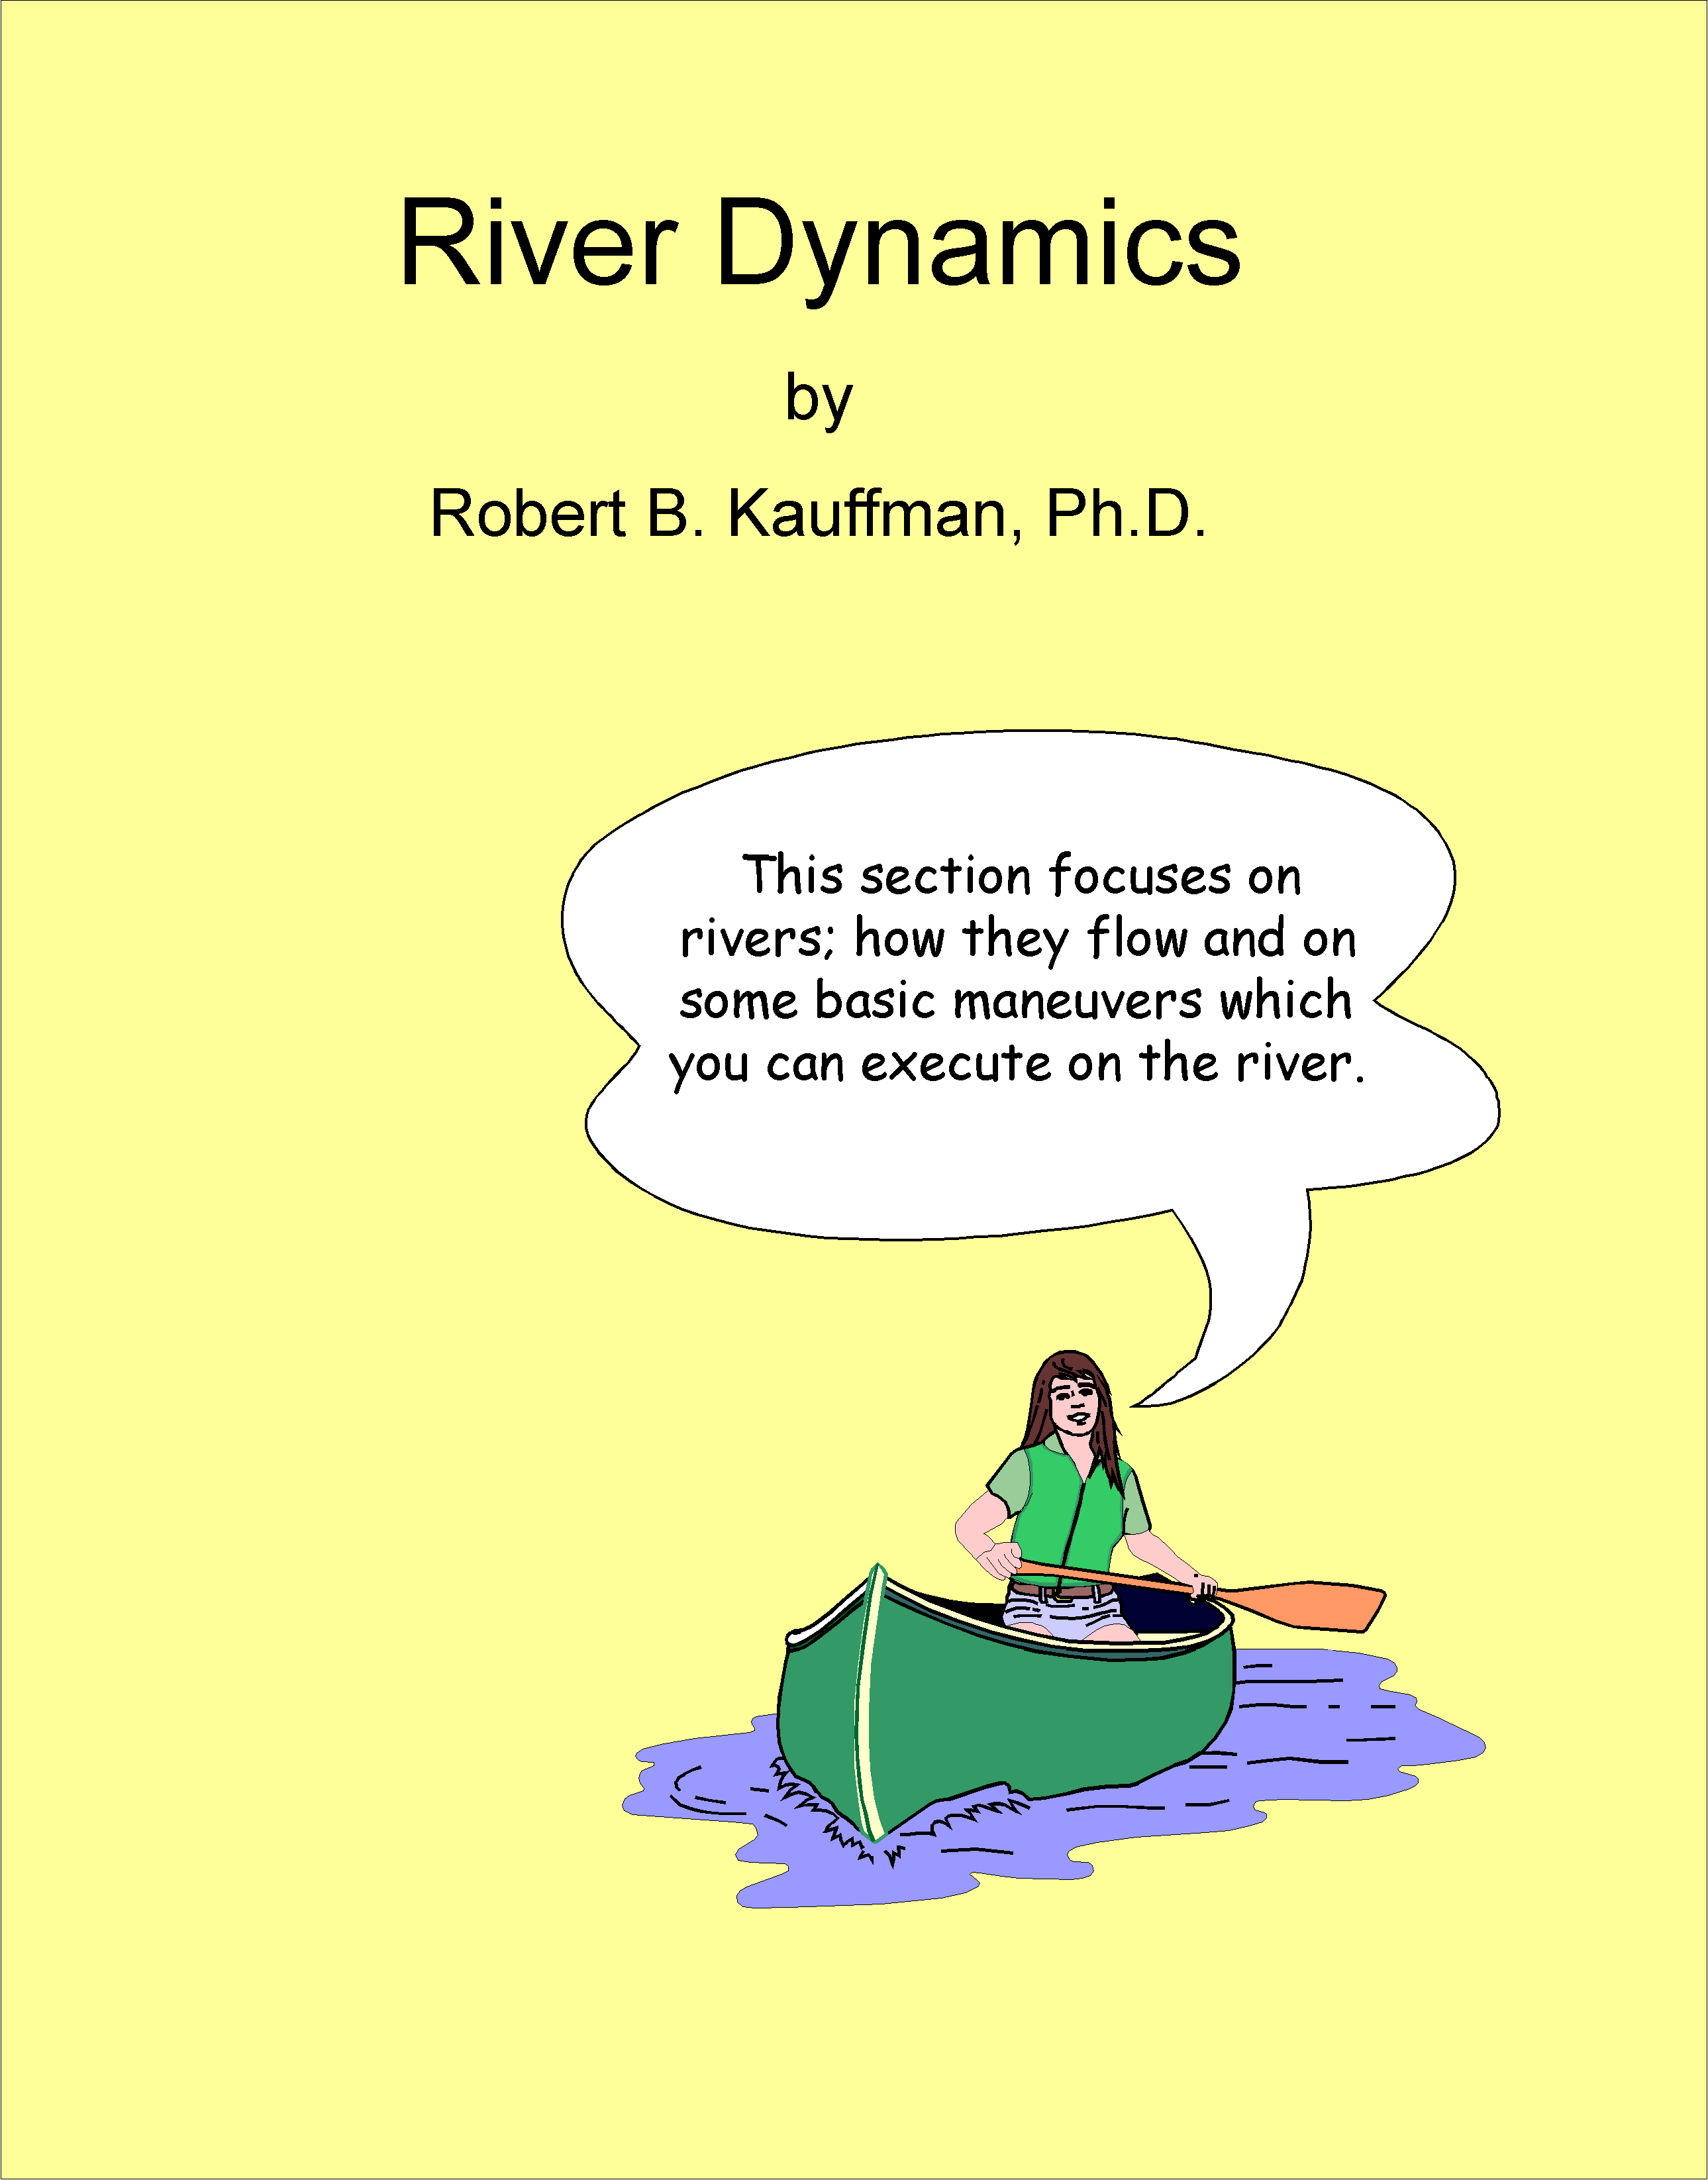
River Dynamics. This power point provides a primer in river dynamics including laminar and shore to center flows, high and low flows, currents, strainers, hydraulics, eddies, waves, and river running techniques. Three power points transformed to pdf files are provided. They are essentially the same. What you can do in a canoe, you can do in a raft and you can pretty much do if you are swimming (e.g. river rescue). The primary difference is who is doing the river runner.
Notes: The three powerpoints are essentially the same power point with a raft, canoe or swimmer demonstrating the maneuvers. For what they do, they are okay. Second, check out the graphics in the swiftwater section. Also, sometime in the future, this section will be moved to its own site with updated graphics.
River Dynamics - Rafting
River Dynamics - Canoeing
River Dynamics - Swimming